Europe Best Ideas
July 2017 Edition
In this months Fat Pitches newsletter, we’re examining investment potential of European companies. Europe has the biggest valuation dispersion gap in the World and is home to many quality companies with long-term duration competitive advantages, at valuations that are often less than their US counterparts. We’ve reviewed analyst’s reports and and came up with a selection of quality companies with undemanding valuations.
Shire (SHP.L)
Shire (SHP.L)
Competitive Strengths
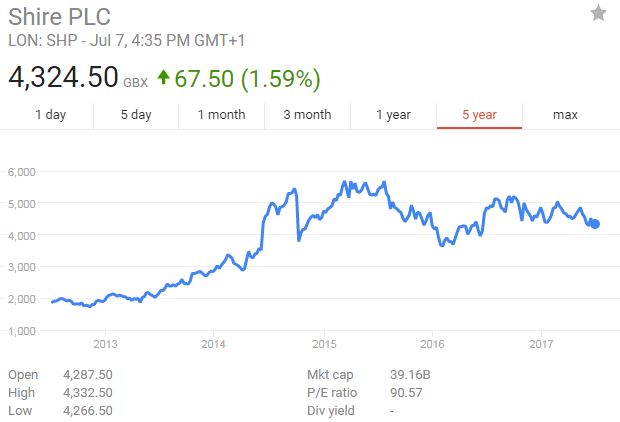
Shire’s providing one of the strongest earnings growth levels of the Major Pharma (11% 2016-21E CAGR). Shire attracts a discount to the European major pharma sector on the account of the risk of the large-scale ongoing integration with Baxalta.
On the assumption that the integration of Baxalta will be executed effectively, Shire will be able to capitalise on Baxalta’s strong international plasma infrastructure and maximise new product launches. The erosion of the haemophilia franchise with Roche’s ACE-910 entry has been well reflected in the overall consensus.
Valuations
Shire’s valuation is particularly attractive when taking into account its significant Free Cash Flow generation to drive balance sheet deleveraging. Shire trades on a 2018 PE of 10.5 vs peers of 15.4 a 32% discount. On an EV/NPV basis Shire trades on an EV/NPV of 1.05. This is a 4% premium to EU peers and on a par with global pharma. However, as free cash flow drives deleveraging, Shire’s equity valuation becomes much more attractive. By 2019 the stock should trade on an EV/NPV of 0.9x, the at lower end of valuation range compared to peers.
| Competitive Advantage | Fair Value Estimate | Stock Price | % to Target Price | Market Cap. |
| Narrow | 5,800.00p | 4,363.64p | 33% | GBP 49.9bln |
| 52 Wk range | ROE (%) | PE Data 2017 | PE Data 2018 | PE Data 2019 |
| 5,377.00p- 4,187.06p | 13.7% | 11.0 | 9.7 | 8.7 |
Euronext

Euronext (ENX.PA)
Competitive Strengths
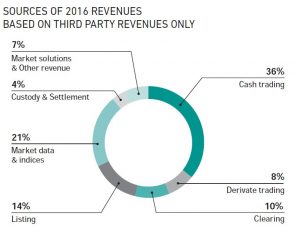 Euronext NV is the Netherlands-based pan European exchange group, offering a diverse range of products and services and combining transparent, efficient and regulated equity, fixed income securities and derivatives markets in Paris, Amsterdam, Brussels, Lisbon and London. Company has diversified revenue streams with entrenched positions in its home geographies as well as very high net margins (38% of sales).
Euronext has strong competition position in its home markets in the areas of domestic issuers listing (14% of sales), market data provisions (21% of sales) and derivative trading and clearing (18% revenue). Euronext is facing increasing competition and lower volumes in its core cash trading business, where competitive position is being eroded with the entry of alternative platforms, intra-bank dealing and OTC. Despite headwinds, we expect that cash trading will remain Euronext’s core business going forward.
Valuations
At 16.1 ’17 PE ratio and 10.4 multiple for ’17 EV/EBITDA, Euronext is value at discount to US exchanges (e.g. CME is trading at ’17 PE of 25.8). The broader exchange group sector, both in the UK/EU and the US, has experienced a sustained rerating as investors further recognise the benefits companies in the sector offer, including high operating profit margins, strong cash flow generation (and low capital consumption), and positive exposure to volatility and higher volumes on largely fixed cost bases. Euronext multiple remains a discount, however discount is warranted since Euronext is primarily equity-focused exchanges, and equity focused exchanges have lower earnings visibility and thus warrant lower multiples.
| Competitive Advantage | Fair Value Estimate | Stock Price | % to Target Price | Market Cap. |
| Narrow | Eur50 | Eur45.6 | 10% | Eur3.1bln |
| 52 Wk range | ROE (%) | PE Data 2017 | PE Data 2018 | PE Data 2019 |
| 49.50- 30.14 | 32.5 | 16.1 | 15.0 | 13.9 |
L'Oreal (OR.PA)
L’Oreal (OR.PA)
Competitive Strengths
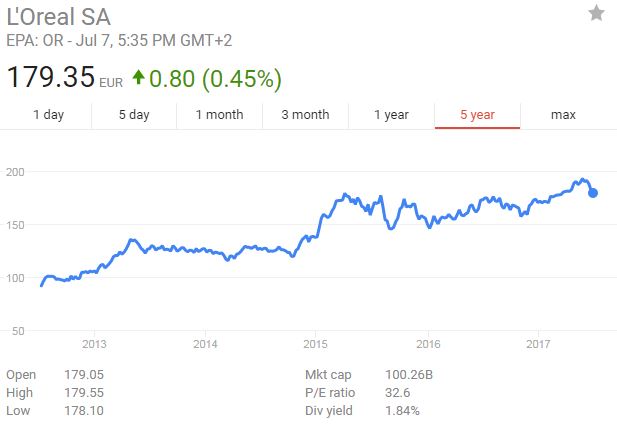
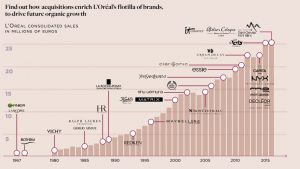 No.1 cosmetics company worldwide with a differentiated and premium offering and strong pricing power. Depth of brand portfolio, international reach and premium branding for personal care products give L’Oreal wide moat. Revenues, earnings and volumes have been steadily and reliably growing year after year. Company has successfully entered many emerging markets, deftly tailoring products to local tastes, following L’Oreal’s “Global Vision and Local Adaptation” principle.
Valuations
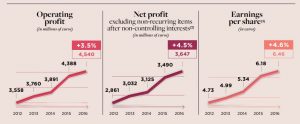 Currently trading at a 20% premium to the sector, versus a long-term average of over 30%. ’18 PE ratio is at 23.5. The churn of innovation in personal care allows for pricing in a low-growth environment and an unlevered balance sheet perpetuates L’Oréal’s ability to acquire local players and leverage its global scale. Last year company achieved annual sales of Eur26bln and Eur4.5bln of operating profit.
| Competitive Advantage | Fair Value Estimate | Stock Price | % to Target Price | Market Cap. |
| Wide | Eur 182 | Eur 179.35 | 2% | Eur 100.3bln |
| 52 Wk range | ROE (%) | PE Data 2017 | PE Data 2018 | PE Data 2019 |
| Eur 197.15 - 156.50 | 15.2 | 25.9 | 24.3 | 22.8 |
MunichRe (MUV2.ETR)
Munich Re (MUV2.ETR)
Competitive Strengths
 Munich Re is the largest P&C reinsurer in the world. Along with the rest of the industry Munich Re is facing continued top-down headwinds with Property & Casualty (P&C) low pricing and historically low interest rates resulting in low investment returns. Munich Re continues to price new business rationally despite challenging pricing environment. Insurance is a commodity business with clients taking the least cost offering leaving re-insurers with little opportunity for differentiation.
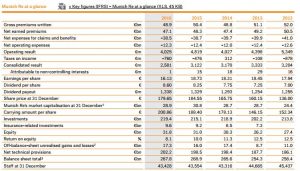
The re-pricing cycle for P&C re-insurance is relatively short-cycle and policies are typically repriced annually. Successful re-insurance companies maintain underwriting discipline by pricing risk adequately and turning away unprofitable business. All companies are talking about it but very few companies actually live it. Munich Re management has demonstrated a credible and long-term track record through rational underwriting behavior and adequate risk pricing. Combined loss ratio continues to be below 100% for many years running. Combined ratio in ’16 was 95.7%, which means that Munich Re is earning profits on the primary P&C underwriting. Returns on equity are coming down due to low investment income on the back of low interest rates.
Valuations
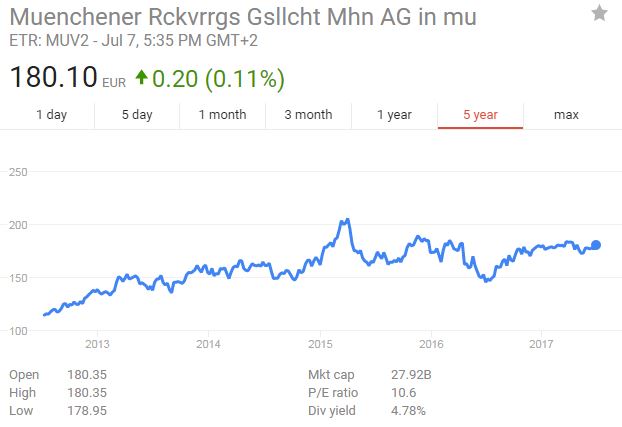
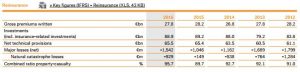 Company offers attractive capital returns in the form of dividends and buybacks (2017E – 4.6% dividend yield and 3.4% buyback yield). This is very attractive yield in the current low interest rate environment. With PE of 11.5 and Price/book at 0.9, valuation is neither demanding, nor particularly cheap. Return on equity has been declining to around 8% due to low interest rates. Munich Re will be one of the key beneficiaries of eventual normalization of interest rates.
| Competitive Advantage | Fair Value Estimate | Stock Price | % to Target Price | Market Cap. |
| None | Eur 182 | Eur 180.1 | 0% | Eur 27.9bln |
| 52 Wk range | ROE (%) | PE Data 2017 | PE Data 2018 | PE Data 2019 |
| Eur 189.40 - 140.90 | 7.6% | 11.8 | 11.2 | 10.4 |
Danone
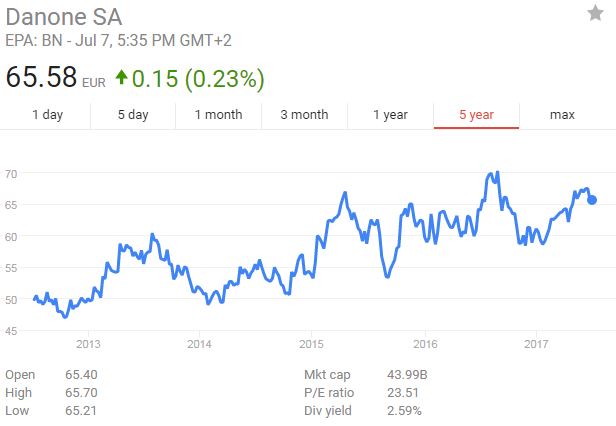
Danone (BN.PA)
Competitive Strenghts
Strong competitive position in diary and infant formula businesses with strong economic, demographic, and consumer trends drive volume growth. On top of population growth in Danone’s geographic footprint, per capita consumption growth is likely to occur in almost all segments, thanks to urbanisation, economic development, and an increasing consumer preference for healthier food and beverages. In 2015, 40% of group sales were derived in emerging markets.
Danone is expected to report a weak growth in Q217 0.2% Likje-for-like (a steady level vs Q117 0.7%) given continuous pressure in WE Dairy.
Valuations
At 2018e 18x PE and 12x EV/EBITDA, Danone trades at a 14% and 12% discount to the EU Food sector on, respectively. Brokers generally maintain neutral rating and Dec-18 PT of €71- €75 using an 18E EV/EBITDA multiple of 12.5x, in line with the Food sector.
| Competitive Advantage | Fair Value Estimate | Stock Price | % to Target Price | Market Cap. |
| Narrow | Eur71-75 | Eur66.86 | 6%-12% | Eur44.1bln |
| 52 Wk range | ROE (%) | PE Data 2017 | PE Data 2018 | PE Data 2019 |
| 70.53- 57.66 | 15.8 | 18.9 | 16.7 | 15.2 |
