
British Dividend Aristocrats
July 2017 Edition
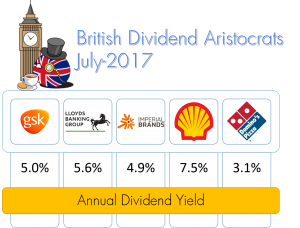 With interest rates at record lows in Europe and UK, we examine British companies with high dividend yield that have the potential to provide investors with an inflation-beating dividend income as well as sustainable capital appreciation.
Even as Britain is poised to exit European Union, many British companies remain global in their nature with sales primarily derived from outside UK. Many companies are selling for less and their European or US counterparts whilst delivering a very attractive dividend yield that investors can expect and rely upon.
Below is the selection of the best British dividend aristocrats.
GlaxoSmithKline (GSK)
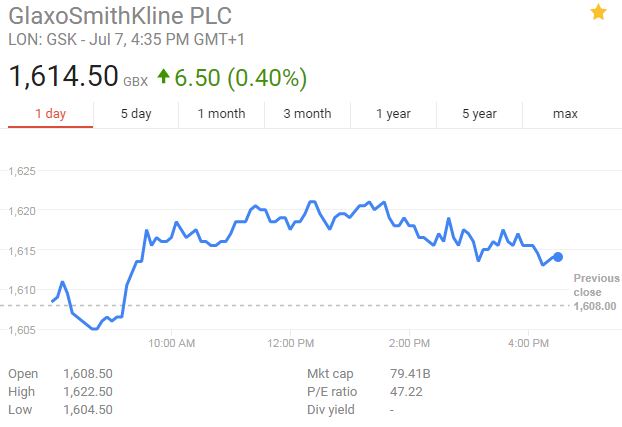
- Dividend Yield 5.0%
GlaxoSmithKline (GSK)
Competitive Strengths
Entrenched competitive position in recurring and/or high volume product categories including HIV franchise (ViiV venture), vaccines, consumer business. GSK is one of the most diversified pharma players, unfortunately GSK has objectively lost edge in innovation in its key pharma franchises including oncology and respiratory diseases. We suspect that this is due to GSK sprawling businesses where management did not have to focus on driving R&D productivity and come up with more blockbuster products (such as strategy adopted by AstraZeneca). As a result, GSK shares have underperformed broader pharma/biotech by significant margin over the past 5 years. GSK pipeline therefore attracts little to no value in absence of more sustained new product launches, despite GBP3.6bln of annual R&D spend.
Valuations
As with all pharma companies, we rely on expert DCF valuation of existing product pipeline (approved, launched and marketed products), with estimates ranging from GBP15 – GBP19 per share. Coupled with dividend yield of 5%, we’d consider GSK a conservative investment with attractive cash element. GSK would need to significantly improve its R&D pipeline productivity (i.e. focus) create more shareholder value as group or engineer a split-up in order to or unlock the value of its respective franchises (spin-off or sale). Business remains highly cash generative with net margins of 18%, return on invested capital of 30% and moderate ’18 PE Ratio of 14.1.
The downside appears to be limited, on DCF basis to GBP14.00 per share, some 10% below current levels. For US based investors, Glaxo is available to invest as sponsored ADR, ticker GSK.
| Competitive Advantage | Fair Value Estimate | Stock Price | % to Target Price | Market Cap. |
| Wide | 1800.00p | 1622.63p | 11% | GBP 80.2bln |
| 52 Wk range | ROE (%) | PE Data 2017 | PE Data 2018 | PE Data 2019 |
| 1745.56- 1446.50 | 30% (adjusted ROIC%) | 14.7 | 14.1 | 13.4 |
Lloyds Banking Group
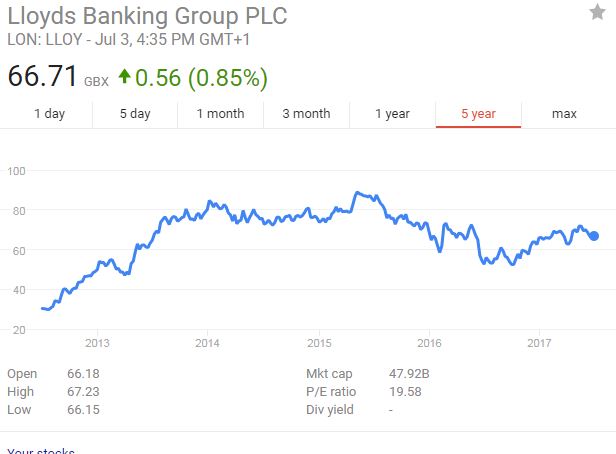
- Dividend Yield 5.6%
Lloyds Banking Group (LLOY.LON)
Competitive Strengths
 Lloyds is UK focused retail and commercial bank which operates a simple and relatively attractive business model. The bank has one of the highest margins in Europe (net interest margin at 2.6%), amongst the lowest cost/income and loan loss ratios and best rates of capital generation. 1Q17 results beat our forecasts, leading to 2-6% EPS upgrades, a higher forecast dividend for 2017 of 7.5% (5p dividend @ 66.7p stock price).
Lloyds has high cost deposit/wholesale funding structure, which it’s gradually unwinding. Lloyds does however have lower reliance on current account funding; and relatively small structural hedge in the event of interest rate increase. Net interest margin is in 2.6% which is expected to continue at current interest rates. Lloyds is above its 13% capital target and has shown a willingness to pay down to this target through ordinary and special dividends.
Asset quality in the UK is very benign and nearly all UK banks report falling impairments. This may naturally change with Brexit, deterioration of economic performance and/or steep rise in interest rates.
Valuations
Lloyds is trading at 9.3x 2018e adj EPS, 1.25x 2017e TNAV, for an adj RoTE of 13.1%. This compares with a European average of 1.13x 2017e TNAV, 11.4x 2018e adj EPS for an adj RoTE of 10%. Lloyds now screens very cheap within Europe banks in analysts’ view.
Woodford recently added Lloyds to his income portfolio as one of Top 10 holdings with 2.17% of the fund invested.
| Competitive Advantage | Fair Value Estimate | Stock Price | % to Target Price | Market Cap. |
| Narrow | 72p-75p | 66.72p | 9%-13% | GBP 47.5bln |
| 52 Wk range | ROE (%) | PE Data 2017 | PE Data 2018 | PE Data 2019 |
| 73.58- 46.74 | 11.1 | 8.9 | 9.3 | 9.2 |
Imperial Brands

- Dividend Yield 4.9%
Imperial Brands (IMB.L)
Competitive Strengths
Imperial Brand’s is the 4th largest publicly traded international tobacco company, with 10% market share (outside China). It’s strategy centers of maximizing cash returns to shareholders through cost cutting, focused set of brands and tight capital allocation. Imperial generates leading profit margins and has embarked on the multi-year journey to reduce number of brands in its portfolio by migrating existing customers to more profitable “growth” brands. Management has a good track record in delivering cash returns to shareholders.
As with all tobacco companies, Imperial possesses strong portfolio of attractive tobacco brands and durable competitive advantages. By their nature, the products are high margin, highly addictive and with high brand loyalty. Imperial has historically been able to offset volume falls with price increases, given low price-elasticity of tobacco products. Outside elicit trade, tobacco companies generally behave rationally and eschew price competition – tobacco industry can indeed be labelled a rational oligopoly.
Advertising bans are creating barriers to entry for new competition. Key risks included plan packaging for tobacco companies, similar to measures enacted in Australia, and currently proposed in the UK. Equally, e-cigarette market is poised to take share over time, either in the form of vaping (Imperial has blue brand present) or “heat-but-not-burn” products (e.g. Philip Morris IQOS products. Imperial has the depth of distribution and brand portfolio to complete in these markets effectively, albeit against smaller and more aggressive competitors than is the case with existing tobacco business.
Valuations
Valuation is very undemanding. Imperial generates return on equity in the range of 30%+ p.a. and management has guided medium term EPS growth at 4%-8%. ’17 PE ratio is 12.8, falling to 12.3 in ’18. Fair price at GBP 4,100p vs current price of GBP 3,448p offers 19% upside.
Imperial is forecasted to pay-out 170p a share of dividends, which given existing price of 3,448p translates to 5% dividend yield.Downside risks are limited, in our view, as Imperial continues to be a potential acquisition target for a large player (e.g. Japan Tobacco) in a consolidating marketplace.
| Competitive Advantage | Fair Value Estimate | Stock Price | % to Target Price | Market Cap. |
| Wide | 4,100p | 3,448.9p | 18.9% | GBP 33.1bln |
| 52 Wk range | ROE (%) | PE Data 2017 | PE Data 2018 | PE Data 2019 |
| 4,154p - 3,324p | 41.9% | 12.8 | 12.3 | 11.7 |
Royal Dutch Shell
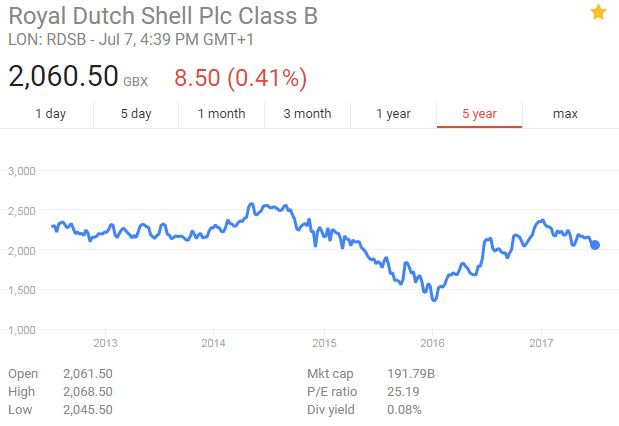
- Dividend Yield 7.45%
Royal Dutch Shell (RDSB.L)
Competitive Strengths
Large footprint – Shell is the largest European integrated Oil & Gas company with 3.8 million boe/d, the largest integrated LNG business, attractive deep-water position and sizeable downstream and chemicals business. The BG acquisition re-positioned Shell down the cost curve. Cost synergies are already trickling through to the bottom line with lower operating cost, lower capital intensity and greater optionality of new investments in higher margin basins. Shell is delivering on its $20bln divestment plan in order to pay down the debt and maintain the dividend.
No moat business – Even though Shell has some enviable positions in prolific and low cost basins around the world, the nature of the oil & gas industry is such that company needs to constantly replenish dwindling reserves. Over time, any advantaged positions get produced away and new acreages and exploration finds are acquired or discovered at prevailing market prices, leading to lower returns. Persistent cost inflation and less favorable economics of new developments drove returns on capital from high 20%s range in 2005 to 3% range today, serving as an indictment to the low efficiency and commodity nature of the business. In absence of material increase in oil and gas prices, it is unlikely that company will be able to return to the previous level (in 20%s) of returns on capital.
World of abundant resources – In the world of abundant hydrocarbon resources, driven by the application of fracking technology, Shell alongside other majors will struggle to differentiate themselves through technological prowess or large scale mega-projects. Akin to disruption in other industries, low-cost industry standard engineering solutions, widely available to all players through supply chain, becoming the winners.
Valuations
Energy transition – Energy transitions are happening as energy mix shifts towards renewables. The transition will likely take decades. Shell and other majors are priced based on existing reserves and cash flows expected to be generated over medium time horizon, typically 10-20 years. Energy companies can still be good investments even in the face of energy transitions, IF bought at the right price.
Delivering cash returns – Shell offers the highest dividend of any oil major with 7.45% yield, which increasingly looks sustainable even in $50 a barrel world. Shell is trading at ’18 PE of 12x, falling to 10x in ’18. Return on capital remains anemic in the sub-$50 a barrel world, however management is sounding more confident of achieving 10% ROACE by end’19 at $60/barrel.
| Competitive Advantage | Fair Value Estimate | Stock Price | % to Target Price | Market Cap. |
| None | 2,450p | 2,053.86p | 19.3% | USD 215.8bln |
| 52 Wk range | ROE (%) | PE Data 2017 | PE Data 2018 | PE Data 2019 |
| 2403.68p - 1869.25p | 7.7% | 15.1 | 12.6 | 11.5 |
Domino's Pizza UK
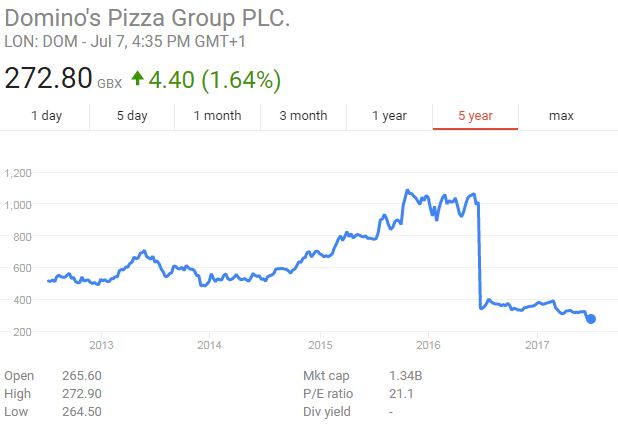
- Dividend Yield 3.1%
Domino’s Pizza UK (DOM.L)
Competitive Strengths
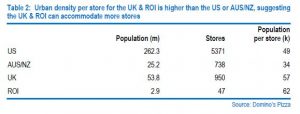
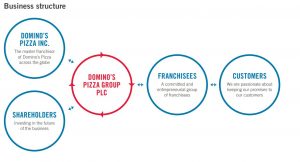 Business Description – Domino’s Pizza is UK based publicly listed company pizza delivery company. The Company holds the franchise rights for the Domino’s brand in the United Kingdom, Republic of Ireland, Switzerland, Liechtenstein and Luxembourg. It has approximately 950 stores in the United Kingdom, approximately 40 stores in the Republic of Ireland and over 10 stores in Switzerland. It owns 1/3 of Germany based Domino’s Pizza and recently entered Nordic markets.
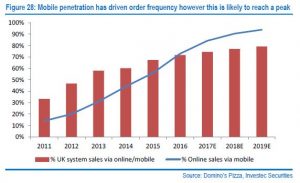 Business model – Company operates through network of franchisee, who pay franchisee fees and buy ingredients for pizzas as well as benefit from centrally provided support services including marketing, supply chain, infrastructure and brand recognition. Over 72% of UK sales in ’16 were ordered through mobile apps.
Runway left – Management has re-sized UK market to 1,600 stored by 2021, targeting 80 store openings per year. The store economics for
franchisees remain healthy, even despite proposed store split.
Evolving marketplace – Millennials are becoming increasingly price sensitive Domino’s’ core customer base is aged between 18 and 35 years (known as millennials) and research suggests this generation is particularly price sensitive, wanting more for less, requiring constant innovation and
exceptional service.

Domino’s has served this customer demographic exceptionally well, with significant investment in technology, product and marketing, leading to a strong financial performance and market position. Domino’s continues to enjoy high brand recognition. However, 3rd party aggregator apps (Just Eat, Deliveroo) as well as traditional competitors (Pizza Hut) are increasingly competing with Domino’s on breath of offering, convenience, price and promotion activity. By some estimates, Domino’s controls 35% of pizza delivery market, which is worth around GBP3.9bln annually and growing 2%+ a year.
Valuations
 Recent fall in Domino’s share price puts shares at ‘17PE of 18.3, falling to 16.6 at the end of ’18 and to 14.86 at the end of ’19. With virtually no debt, return on equity of 50%-60%, dividend yield of 2.7% and further 2% of share repurchases, we believe that Domino’s is attractively value. Whilst upside is driven by competitive market dynamics, the downsize in our opinions is limited given strong existing cash-generative portfolio and ability to expand network through additional store openings.
| Competitive Advantage | Fair Value Estimate | Stock Price | % to Target Price | Market Cap. |
| Narrow | 350p | 272.80p | 28% | GBP 1,342mln |
| 52 Wk range | ROE (%) | PE Data 2017 | PE Data 2018 | PE Data 2019 |
| 405.60p - 264.30p | 61.3% | 18.3 | 16.6 | 14.9 |
