Top 10 Compounders Over the Past 15 Years (2002-2017)
How much would $1 invested on 1st January 2002 be worth today?
Top Compounders
We have asked ourselves 3 questions:
- If we owned top 10 performing companies over the past 15 years, that is from 2001 to 2016, what would be our average gain?
- What are the commonalities, if any, that these companies possess that made them top of their group in total market return?
- Could an ordinary investor have identified these companies prior to their astonishing run?
Top Compounders as a group
The average total return that investor would have enjoyed over 15 years owning a basket of top compounders is an astonishing 102.16x net multiple. That means that by putting in $1 on 1st Jan 2012 in this group of stocks, the investor would have compounded the investment over 103.16 fold. For comparison, S&P 500 returned 1.88 fold or 188% net so $1 would have grown to $2.88. So our group has outperformed the index by over 35 fold.
Skewing with the group
Top member of the group
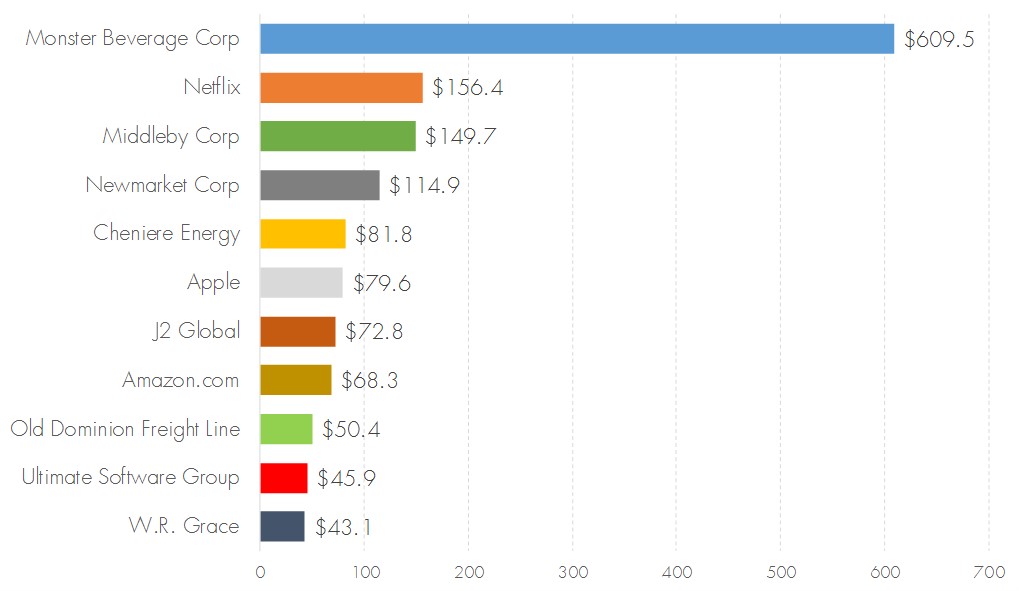
Monster Beverage returned astonishing 609.47x net return, followed by Netflix (156x), Middleby (149x), Newmarket Corp (114x), Cheniere (81x) , Apple (79x), J2 Global (72x), Amazon (68x), Old Dominion Freight (50x), Ultimate Software (45x) and WR Grace (43x).
![]()
Monster Beverage – the Birth of a global beverage giant
Ever so often, new brand emerges that scales and travels globally. Monster Energy drink proved to be such hit product and was the source behind meteoric rise of Monster Beverage Corp. The case study proves the point that one a profitable product is discovered with a large potential market and long runway, the compounded sales and market cap growth often exceeds even the wildest expectations.
Blockbuster Product
In 1998, Monster had revenue of $53.9mln, since then for the uninterrupted period of 18 years, Monster has been growing it’s sales at an astonishing rate of 25% per year. Sales have growth from $53.9mln in 1998 to $3,049mln in 2016. Investors could have bought Monster (or Hansen Natural Corp as it was then known) for PE of 10 in 1999 and 2000, when the market cap was $40mln, less than sales, even as company was profitable and posting high sales growth. In 2004 annual report, CEO reported that Monster “had our 12th consecutive year of increased sales since our acquisition of the Hansen’s® beverage business in 1992.” This indicates that there existed a long-term track record of growth and delivery by the management. Monster Energy™ has been company’s hit product.
“Net Sales. For the year ended December 31, 2004, net sales were $180.3 million, an increase of $70.0 million or 63.4% higher than net sales of $110.4 million for the year ended December 31, 2003. We again achieved record sales in 2004. The increase in gross and net sales in 2004 was primarily attributable to increased sales by volume of our Monster Energy(r) drink, which was introduced in April 2002, including our low carbohydrate (“lo-carb”) Monster Energy(r) drink which was introduced in 2003.” The fortunes of Hansen was clearly transformed by the introduction of hit product Monster Energy drink.
By the end of 2004, market cap of Hansen/Monster went up 10x to $400mln on the sales of $180mln, from $40mln market cap and $92mln sales 3 years prior. The gross margin on Monster was around 46% and product scaled really well as different varieties of drink were introduced.
Nationwide Distribution and Scaling
In 2006, company entered into distribution agreements with Anheuser-Busch to distribute and sell the United States giving Monster access to worldclass distribution network in the US. Clearly a watershed moment.
Company’s market cap increased 10x again by 2007 to $4bln on sales of $900mln, subsequently fell during the financial crisis only to recover to $4.7bln by end 2010 on sales of $1.3bln. Throughout financial crisis from 2007 to 2010, Monster has posted sales growth in every single year. Monster drink become one of the best selling convenience food drink in the US,
Going international
In 2008, Monster has entered into a distribution agreement with The Coca-Cola and Anheuser-Bush to utilize their vast distribution network and tap into international markets, mainly in Europe and later in Latin America (2009), Asia (2009) and Middle East (2010). By 2012, Monster has renamed itself (from Hansen) and sold their drinks in over 90 countries. Market cap doubled again to $8.7bln and sales reached $2bln.
By 2014, The Coca-Cola took notice. Extract from 2014 annual report: “2014 was also a milestone year for the Company. During the year, the Company entered into significant agreements with The Coca-Cola Company (“Coca-Cola”), providing for a long term strategic partnership with Coca-Cola. Pursuant to such agreements, we (1) issued shares to CocaCola representing 16.67% of our total outstanding shares; (2) acquired Coca-Cola’s worldwide energy drink business; (3) sold our non-energy drink business to Coca-Cola; and (4) agreed to expand the distribution of our energy drink business in the United States with Coca-Cola bottlers and to treat the international Coca-Cola bottlers as our preferred distribution partners. In turn, Coca-Cola paid us a net cash amount of approximately $2.15 billion.” End 2014 market cap was $18bln on sales of $2.5bln.
By early 2017, market cap will almost double again to $30bln, on sales of $3bln (end 2016), as the full might of Coca-Cola distribution network kicks in. It worth to observe that market cap ($30bln) is now almost 10 times higher than the sales ($3bln) whereas in 2002 the market cap ($40mln) was half of sales ($90mln). The company’s stock has benefit from 20x fold rise in sales multiplier, on top of 30 fold rise in sales – giving 600x total investment return to the stockholders.
Could observant investors have bought in
It is conceivable that observant investors should have noticed the popularity of Monster Energy drink in 2006 with Anheuser-Bush distribution agreement. By 2008, Monster sales hit $1bln and its popularity and ability to travel was beyond doubt. This was before international expansion. If observant investor bought at the end of 2006, the total investment returns would be 951% over ensuing 10 years. At the end 2006, Monster was selling for $3bln market cap on $600mln sales and PE of 34. Whilst very high PE indeed, an observant investor could have asked how far could $600mln annual sales of Monster drink go after further penetration of US and an inevitable international expansion. In other words, the runway left for the product in this case justified lofty valuation.
If investor were to wait until end 2008 during financial crisis and after international expansion started, the adjusted PE ratio would be 18 and market cap of $3bln. The returns of the next 8.5 years would similarly be 1,001%, 10 fold increase.
Monster Beverage Corp – Financials 1998 – 2016
